Study | 12.16.21
Intrics Holiday Index: Price perception vs. reality
In October, the authority on consumer price index (CPI), the Bureau of Labor Statistics (BLS), reported a CPI increase of 6.3% for October 2021 compared to October 2020. This was picked up by various national and industry news outlets in early November, who reported increases in supermarket purchases by 5.4% of beef by +20.1%, pork by 14.1%, chicken by 8.8% and turkey by as much as 21%. For the consolidated categories, outlets reported that meat, poultry, fish & eggs increased by 11.9%.
Key Insights

National and industry news channels reported record high price increases in early November. But actual prices were 3.1% below CPI, suggesting retailers are absorbing a large portion of the increase on key holiday items.

Various sources reported turkey price increases up to 21%. However, our exploration of actual consumer prices has shown they were 4.5% lower than CPI, and only 2.3% higher than November 2020.

Averaged or consolidated indexes as a one-size-fits-all approach for price adjustments misses the mark. Product/SKU level indices are required to find relevant changes by competitor retailers in the market.
In October, the Bureau of Labor Statistics (BLS) — known as the authority on consumer price index (CPI) — reported a CPI increase of 6.3%1 for October 2021 compared to October 2020. This was picked up by various national and industry news outlets in early November, who reported increases in supermarket purchases by 5.4%1 of beef by +20.1%2, pork by 14.1%3, chicken by 8.8%4 and turkey by as much as 21%5. For the consolidated categories, outlets reported that meat, poultry, fish & eggs increased by 11.9%6.
As is well known in the industry, CPI is based on high-level average market data. So it tends to tell a different story than individual grocery items and strategies in their peak season. The holidays may be the season of joy, but it is also the season to attract new clients, set a price perception, and build brand loyalty for the following year.
Intrics completed a study analyzing pricing trends across the US over the last 2+ years for key grocery items that would typically be included in a holiday meal. This study included multiple retailers representing over 50% of the US grocery market. The holiday index was created using a combination of national and regional products, including private label items across retailers, resulting in a common basket of 18 items. For the study, lowest possible price for an item was analyzed, meaning if an item was on promotion, that price was included.
Much of the news leading up to Thanksgiving made consumers very concerned about what they would find when doing their holiday dinner shopping. During the weeks prior to Thanksgiving, shoppers were confronted by messages about rising prices and product shortages.
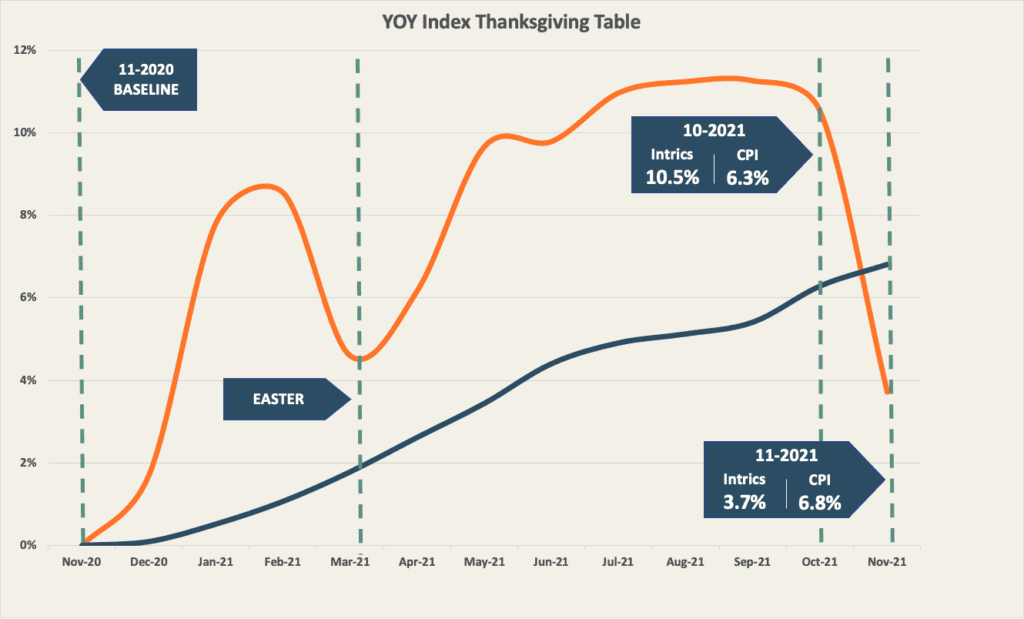
To find the full story, Intrics analyzed the annual trend around individual products with major roles during family holidays. In tracking the Intrics holiday index of 18 items, we found that while the CPI has risen over 6% when compared to last Thanksgiving, the total cost of a holiday meal is only up just over 3% when factoring in retailer promotional strategies.
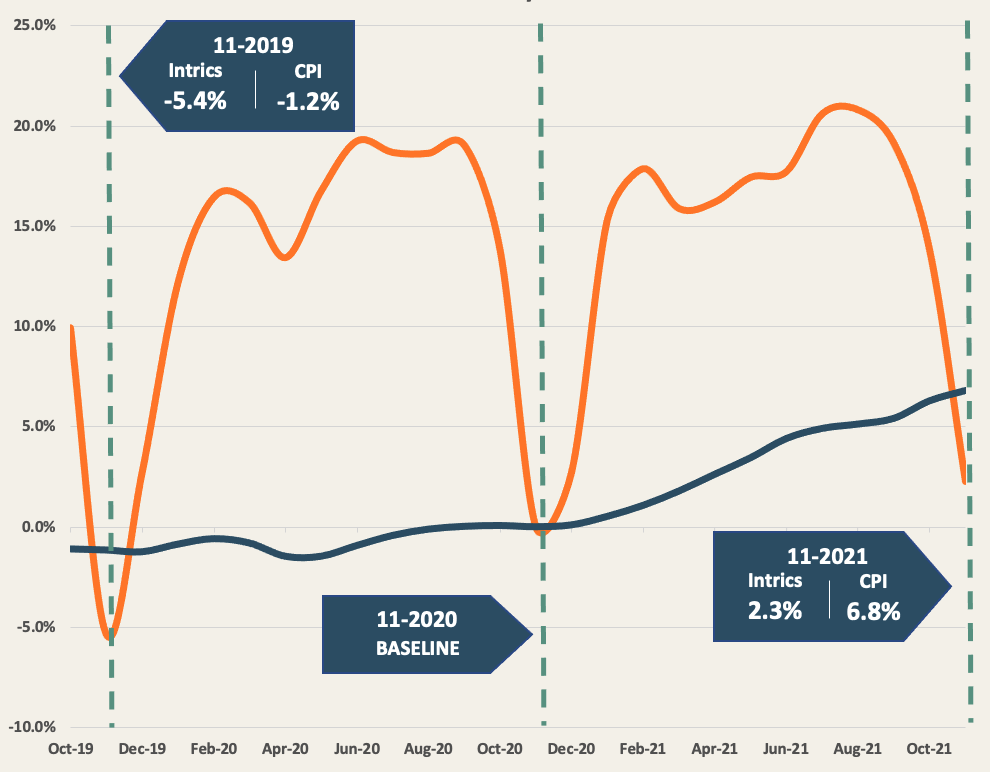
Highlighting a few key items that have a place on almost everyone’s holiday table, we find an interesting trend with almost identical price dips during the holidays, and highly inflated prices for the rest of the year. Understanding the grocery industry’s drivers like basket leaders and loss leaders, we can understand the pricing decisions made on certain categories, and why they would not follow the market indexes.
Prime examples of these include canned pumpkin, canned cranberry sauce and, of course, turkeys. Indexing turkey prices for November 2020 as our base, we find the expected promotional dips around the holiday season, up to a point where they are 4.5% lower than the CPI. Turkey is the best example of a loss leader, as it is heavily advertised and used to attract new and existing customers to shop at specific stores.
When looking further into the items within the holiday meal, there was a clear difference in pricing of fresh products such as turkey, green beans, and potatoes which are primarily domestically sourced vs. more heavily imported items such as wax paper and aluminum foil.
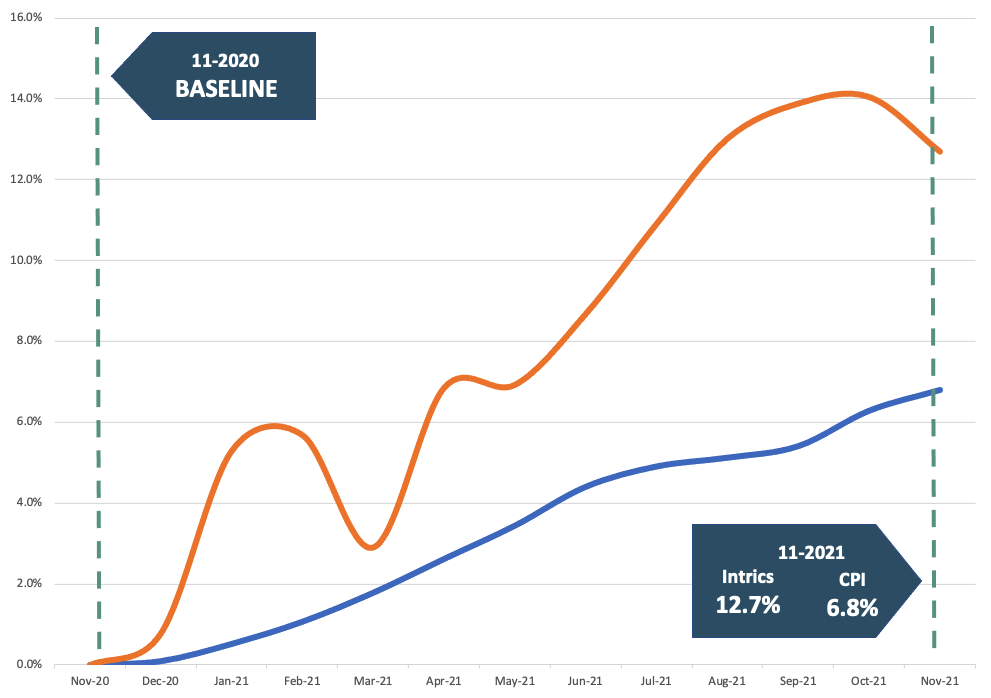
Fresh items followed a consistent pattern of being priced below CPI during the holiday season as retailers worked hard to capture customer loyalty vs. items like wax paper and aluminum foil prices trend 5.9% higher than the CPI index at 12.7%. In considering consumer price elasticity for these non-consumable items and the materially different supply chain, retailers are less able or inclined to absorb price increases for these non-consumables.
CPI is still a relevant market statistic, but it does not fully encapsulate the nuances of the grocery industry during periods where items and prices are heavily adjusted and consumer spending is well above average.
The Bureau of Labor Statistics’ Producer Price Index (PPI), which monitors the average fluctuation in selling prices by producers, shows an increase of 25.4%7 in processed food prices in October 2021 compared to 2020. Based on this, it is not unreasonable to think that grocery foods will see a continued price increase. But the question will always be which individual products are impacted, and which retailer(s) will be the first to react.
Intrics provides insights and clarity by analyzing 7.6 million prices across 25 of the country’s leading grocers nationwide. By considering national brands and private label alike, and linking disparate SKUs and descriptions to a single UPC, Intrics provides product-level indexes in your markets. This allows you to be the first to react by quickly understanding changes to product prices, whether your competitors are absorbing or forwarding increased costs to consumers, as well as how your prices and price changes compare to theirs.
CPI Sources
1 https://www.ers.usda.gov/data-products/food-price-outlook/summary-findings/
2 https://www.supermarketnews.com/retail-financial/food-inflation-stands-out-october-consumer-pricing-surge
3 https://www.supermarketnews.com/retail-financial/food-inflation-stands-out-october-consumer-pricing-surge
4 https://www.cnn.com/2021/11/10/business/grocery-prices-inflation-meat/index.html
5 https://consumerbrandsassociation.org/blog/behind-the-holiday-table/
6 https://www.cnbc.com/2021/11/10/consumer-price-index-october.html
7 https://www.bls.gov/news.release/ppi.nr0.html